


Monitoring and Logging on GCP: A Guide to Stackdriver for Better Observability
- Ashish Tiwari
- Oct 20, 2024
- 5 min read
Updated: Oct 21, 2024
In today's cloud-driven world, maintaining a reliable and secure infrastructure is critical for any organization. Whether it's preventing downtime, troubleshooting issues, or optimizing performance, monitoring and logging play a key role in ensuring the smooth operation of cloud environments. In Google Cloud Platform (GCP), the built-in observability tool, Google Cloud's Operations Suite—formerly known as Stackdriver—provides robust monitoring, logging, tracing, and error reporting capabilities to help you achieve full visibility across your cloud infrastructure.
This guide walks you through how to effectively use Stackdriver (Google Cloud’s Operations Suite) to monitor and log your applications and infrastructure, ensuring better observability and improved operational performance.
What Is Google Cloud’s Operations Suite (Stackdriver)?
Google Cloud's Operations Suite, widely known as Stackdriver, is an integrated monitoring, logging, and management solution for applications running on GCP and even on hybrid or multicloud environments. It provides several services to track the health, performance, and reliability of your applications.
Key Features of Google Cloud’s Operations Suite:
● Logging: Collects and stores logs from various sources for analysis and troubleshooting.
● Monitoring: Tracks the performance and health of your applications in real time.
● Error Reporting: Automatically detects and reports errors in your cloud environment.
● Tracing: Provides distributed tracing to pinpoint performance bottlenecks.
● Profiler: Continuously analyzes code execution and performance.
Why Use Stackdriver for Monitoring and Logging?
Without proper monitoring and logging, detecting anomalies, security incidents, or performance issues becomes difficult, and troubleshooting takes longer. Here's why using Stackdriver is beneficial:
Unified Observability: Stackdriver integrates monitoring, logging, and error reporting under one roof, making it easier to diagnose issues.
Hybrid and Multicloud Support: It supports not just GCP, but also AWS, Kubernetes, and hybrid environments.
Automatic Alerts: Real-time alerts notify you when thresholds are breached, helping you take swift action.
Troubleshooting Made Easy: Stackdriver centralizes all log data, making it easier to identify root causes of system failures.
Cost-Effective: It’s easy to start small and scale as needed.
Setting Up Stackdriver: Step-by-Step Guide
Step 1: Enable Google Cloud Operations Suite
First, you need to enable the Stackdriver services within your GCP project:
Go to the Google Cloud Console.
Choose your existing project or start a new one.
Navigate to APIs & Services > Library.
Search for Google Cloud Operations Suite API (formerly Stackdriver).
Click Enable.
Now that Stackdriver is enabled, you can start configuring logging and monitoring for your applications.
Step 2: Set Up Monitoring with Stackdriver
Monitoring is crucial for ensuring that your system is healthy and performing well.
Go to Monitoring: In your Google Cloud Console, navigate to the Monitoring section.
Create a Workspace: If this is your first time, you’ll need to create a Monitoring Workspace. Stackdriver automatically generates a workspace linked to your project.
Set up Dashboards: Under the Dashboards tab, create custom dashboards to visualize the performance metrics of your GCP resources like VMs, databases, and Kubernetes clusters.
Example: For a real-time view of your infrastructure, create a dashboard with metrics such as CPU utilization, memory usage, and network traffic.
Create Uptime Checks: Uptime checks allow you to monitor whether your applications are available externally. To create one, click Uptime Checks > Create Uptime Check. Provide details such as the URL of the service you want to monitor, the HTTP method, and the frequency of checks.
Configure Alerts: Alerts notify you when there are issues such as resource overload or application failure. In the Alerts section, create an alerting policy by specifying the metric you want to monitor (e.g., high CPU usage), setting a threshold, and defining n

otification channels (email, Slack, etc.).
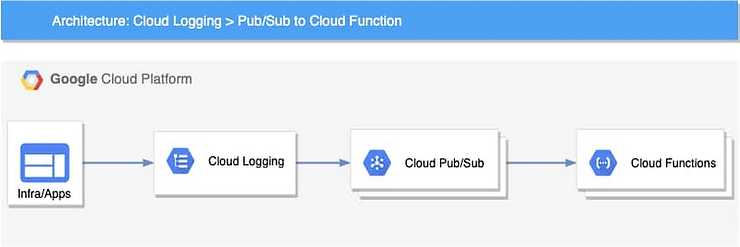
This diagram illustrates how GCP’s operations suite (Stackdriver) integrates with your application’s microservices, databases, and VMs for comprehensive monitoring. It displays how metrics flow into Stackdriver, where they are analyzed and visualized, and how alerts are triggered based on thresholds.
Step 3: Configuring Logging with Stackdriver
Logging provides detailed insights into system behavior and can be invaluable when troubleshooting.
Go to Logging: In the Google Cloud Console, go to Logging under the Operations section.
View Logs: Stackdriver automatically collects logs from GCP services like Compute Engine, Cloud Functions, Kubernetes, and Cloud Run. In the logs viewer, you can filter logs based on criteria such as resource type, severity, and timestamps.
Example: To monitor error logs from a Compute Engine VM, filter the logs for that specific instance and set the severity to ERROR or CRITICAL.
Export Logs: You can export logs to other GCP services for long-term storage or further analysis. Click on Logs Router > Create Sink to export logs to Cloud Storage, BigQuery, or Pub/Sub.
Set Up Log-Based Metrics: Log-based metrics allow you to create custom metrics based on log data. For instance, you can create a metric to track the number of failed login attempts to your application and then set an alert when the number exceeds a threshold.
Real-World Case: Troubleshooting with Logging
Let’s say your e-commerce application hosted on Google Kubernetes Engine (GKE) is facing frequent crashes. You check the logs and notice repeated memory errors from one of the microservices. Based on these logs, you adjust the memory limits of the Kubernetes pod, resolving the issue without significant downtime. This is the power of effective logging and observability.
Step 4: Tracing and Profiling Your Applications
Stackdriver’s Tracing and Profiler tools are designed to help you understand application performance at a deeper level.
Set Up Tracing: Distributed tracing tracks requests across multiple services in your architecture, giving you a granular view of how each component performs.
○ Enable Cloud Trace API in your GCP project.
○ For GKE or Compute Engine, integrate tracing into your application by installing client libraries such as OpenTelemetry.
Example: If your application has a multi-tier architecture, tracing will show you how long each service takes to process a request, allowing you to pinpoint performance bottlenecks.
Set Up Profiling: Cloud Profiler helps reduce latency by identifying code execution hotspots.
○ Enable Cloud Profiler API and integrate it into your codebase.
○ Profiler continuously analyzes application performance without affecting production traffic.
Example: If you notice performance degradation, you can use Profiler to identify functions in your code consuming excessive CPU or memory and refactor them.
Step 5: Setting Up Error Reporting
Error reporting is an essential feature that helps detect and aggregate errors from your applications.
Enable Error Reporting: In the Operations section, navigate to Error Reporting.
View and Analyze Errors: When an application error occurs, Stackdriver aggregates the errors and provides insights such as stack traces and affected users.
Fix the Issues: Once you identify the cause of the error, push a fix, and monitor if the errors decrease in real-time.
Achieve Full Observability with Stackdriver
By following these steps, you can ensure that your infrastructure on GCP is fully monitored and logged, giving you complete visibility into the performance, health, and security of your applications. From setting up monitoring and dashboards to configuring error reporting and tracing, Stackdriver offers a one-stop solution for observability on GCP.
Disclaimer
The information provided in this blog is for educational purposes only. The steps and configurations mentioned may change over time as Google Cloud updates its services. Always refer to the latest official documentation for the most accurate guidance.
Comentários